 Stock Lookup
 Stock Lookup
Stock Lookup on PcProg, allows you to view and maintain inventory received and sold as well make inventory adjustments. Stock received and adjusted will be created by inserting new entries and specifying the product and amount added or subtracted. Stock sold entries will be auto-generated by downloading sales from your APOS device or devices. When inserting stock received and adjusted entries or downloading stock sold entries, only products flagged as stock items at the Department or Product level will be included. Please note that Stock Control can also be managed directly on GoPOS by enabling Setting 96 - "Use Stock Control on GoPOS". If enabled, stock control will no longer be available on PcProg.
|
Department |
|
|
Stock entries may be viewed by "All" departments or viewed by a specific department by selecting the appropriate department from the drop down list. The Total Stocked Products, Total Items in Stock and Quantity pie charts will be updated to reflect the counts and totals of the items in the specified department. You may also further refine this list by entering a search value in the Filter field. |
|
Total Products |
|
|
The Total Stocked Products is a count of all products flagged as "Stock" at the department or product level. This count is affected by the Department selection as well as by the filter being used. Only stock items currently displayed in the data grid are included in the count. Setting the Department to "All" and removing all filters will count all items flagged as "Stock" in your database. |
|
Total Items |
|
|
The Total Items in Stock is a count of all items currently on hand. This count is affected by the Department selection as well as by the filter being used. Only stock items currently displayed in the data grid are included in the count. Setting the Department to "All" and removing all filters will count the number of items on hand for all items flagged as "Stock" in your database. |
|
Quantity Received |
|
|
This pie chart represents the top 25 quantity received for the items currently displayed in the data grid. Each slice of the pie chart represents a single product. Hovering your cursor over a slice will display the product name, total quantity received and percentage of all products received in the pie chart. Selecting an item in the data grid will highlight the slice representing the selected product. |
|
Quantity Adjusted |
|
|
This pie chart represents the top 25 quantity adjusted for the items currently displayed in the data grid. Each slice of the pie chart represents a single product. Hovering your cursor over a slice will display the product name, total quantity adjusted and percentage of all products adjusted in the pie chart. Selecting an item in the data grid will highlight the slice representing the selected product. |
|
Quantity Sold |
|
|
This pie chart represents the top 25 quantity sold for the items currently displayed in the data grid. Each slice of the pie chart represents a single product. Hovering your cursor over a slice of the pie chart will display the product name, total quantity sold and percentage of all products sold in the pie chart. Selecting an item in the data grid will highlight the slice representing the selected product. |
|
Quantity on Hand |
|
|
This pie chart represents the top 25 quantity on hand for the items currently displayed in the data grid. Each slice of the pie chart represents a single product. Hovering your cursor over a slice of the pie chart will display the product name, total quantity on hand and percentage of all products on hand in the pie chart. Selecting an item in the data grid will highlight the slice representing the selected product. |
|
Search Filter |
|
|
Entering a search text will filter the list of stock items and only display product names containing the entered text. The Total Stocked Products, Total Items in Stock and Quantity pie charts will be updated to reflect the counts and totals of the items in the filtered list. If this field is blank, all stocked items in the selected department will be displayed. |
|
Clicking on the Update Stock Received Data button will display the Stock Received Maintenance window.
|
|
|
|
|
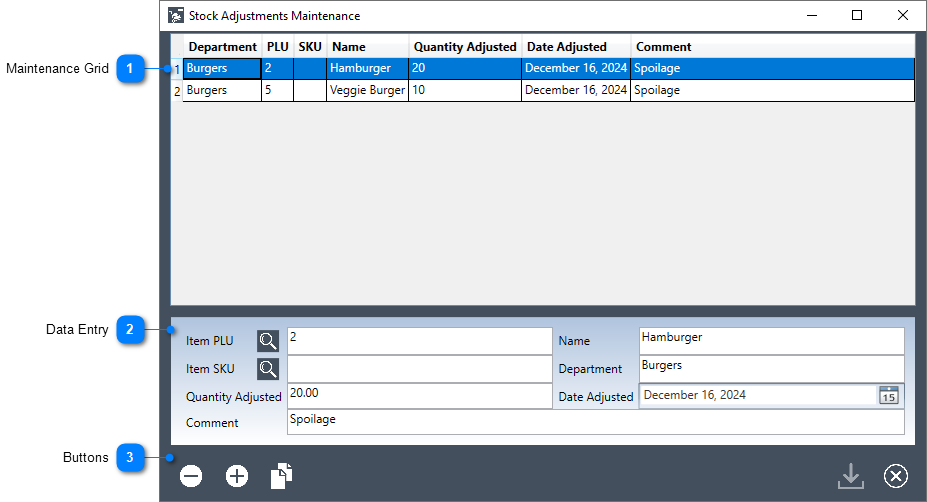
Clicking on the Update Stock Adjustments button will display the Stock Adjustments Maintenance window.
|
|
|
|
|
|
Clicking on the Update Stock Sold Data button will display the Update Stock Sales Data window.
|
|
|
|
|
|
Stock Grid |
|
|
The grid area displays the currently defined stock entries. Once the focus is within the grid area, you may use the arrow-up and arrow-down keys to navigate through each of the rows. Selecting an item in the data grid will highlight the slice in the pie charts representing the selected product.
All fields are display-only and all updates to stock sold must be performed by clicking on the Update Stock Sales Data button or by downloading the Period 4 - "Yearly" report in the reports module. Stock received entries and adjustments must be entered by clicking on the Update Stock Received or Update Stock Adjustments button or by double clicking on a row to display the Stock Maintenance Window.
|
|
|
Portrait/Landscape |
|
|
This button display the current page orientation of the stock report. Clicking on Landscape will change the orientation of the report from landscape to portrait. Clicking on Portrait will change the orientation from portrait to landscape. |
|
Stock Report Viewer |
|
|
Click on this button to view the Stock Report selected, showing amounts received, amounts sold and quantity on hand. The Portrait/Landscape buttons displays the current page orientation of the stock report. Clicking on Landscape will change the orientation of the report from landscape to portrait. Clicking on Portrait will change the orientation from portrait to landscape.
|
.png)
-number-1.png)
-number-2.png)
-number-3.png)
-number-4.png)
-number-5.png)
-number-6.png)
-number-7.png)
-number-8.png)
-number-9.png)
.png)
.png)
.png)
.png)
-number-10.png)
.png)
(1).png)
(1).png)
-number-11.png)

-number-12.png)
.png)
.png)
.png)
.png)
-number-13.png)
-number-14.png)
.png)
-number-15.png)
.png)